# indlæs relevante R-pakker
library(shiny)
library(leaflet)
library(leaflet.extras)
library(jsonlite)

# Grafisk brugeroverflade
ui <- fluidPage(
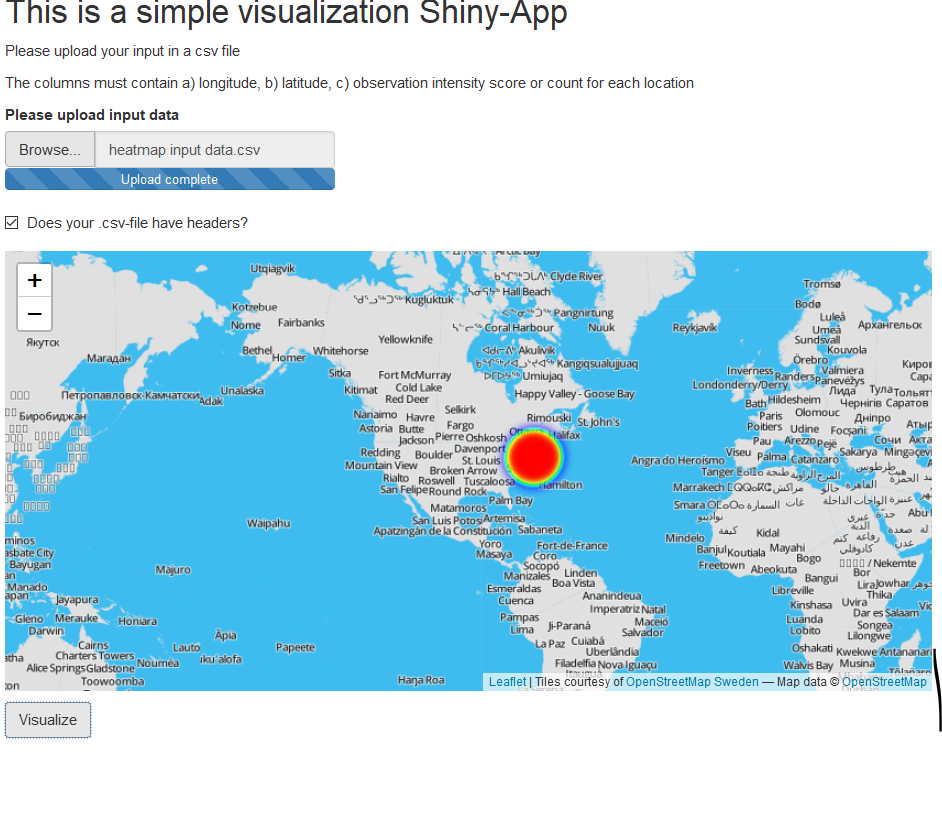
  titlePanel("This is a simple visualization Shiny-App"),
  p("Please upload your input in a csv file"),
  p("The columns must contain a) longitude, b) latitude, c) observation intensity score or count for each location"),
  fileInput(inputId="input_file",label="Please upload input data",placeholder=""),
  checkboxInput(inputId="input_header",label="Does your .csv-file have headers?",value=TRUE),
  leafletOutput(outputId = "map_result"),
  p(""),
  actionButton(inputId="input_button",label="Visualize")
)

# Server
server <- function(input,output){
  output$map_result <- renderLeaflet({
    # call to action button
    input$input_button

    # inlæs og manipuler data
    isolate({
      data_file <- req(input$input_file)
      if(is.null(data)){
        return(NULL)
      }else{
        data <- read.csv(file=data_file$datapath,header=input$input_header)
      }

      # visualiser resulterende data
      leaflet() %>%
        addProviderTiles(provider=providers$Hydda) %>%
        setView(lng= mean(data[,1]), lat=mean(data[,2]), zoom=6) %>%
        addHeatmap(lng =data[,1] , lat=data[,2] , intensity=data[,3])
    })
  })
}


# APP
shinyApp(ui=ui,
         server=server)


Industriingeniør som gerne beskæftiger sig med optimering, simulation og matematisk modellering i R, SQL, VBA og Python


Leave a Reply