In previous posts I have demonstrated how to geocode location strings using the Open Street Map API in two different ways.
The first approach was to implement a function that sents a string to the OSM API directly, using http. The API then returns spatial coordinates in json-format.
The second approach was to use the osmdata package in R, more specifically its getbb() function. This function returns a matrix with latitude and longitude values for a given location string, i.e. it does the same as the function implemented for the first approach but it must not be implemented from scratch.
In this post I show another package in R that allows for simple geocoding, using OSM API: The tidygeocoder R-package.
In the lines below I construct a data frame template with pre-defined location names (character strings).
# defining a data frame template to populate throughut geocoding process
data_df = as.data.frame(matrix(nrow=20,ncol=3))
colnames(data_df) = c("location","lat","long")

# adding city and town names as locations
data_df$location = c("Hamburg, Germany",      #1
                     "Dortmund, Germany",    #2
                     "Stuttgart, Germany",     #3
                     "Berlin, Germany",        #4
                     "Dresden, Germany", #5
                     "Bremen, Germany", #6
                     "Leipzig, Germany",   #7
                     "Kiel, Germany",    #8
                     "Rostock, Germany",  #9
                     "Karlsruhe, Germany",     #10
                     "Siegen, Germany",  #11
                     "Bonn, Germany",     #12
                     "Essen, Germany", #13
                     "Gelsenkirchen, Germany",     #14
                     "Marburg, Germany",       #15
                     "Frankfurt am Main, Germany",      #16
                     "Heidelberg, Germany",    #17
                     "Freiburg, Germany",      #18
                     "Pforzheim, Germany",    #19
                     "Flensburg, Germany"  #20
                     )
Next, I geocode the locations using the tidygeocoder package in R. More specifically, I use its geo_osm function
# importing tidygeocoder package in R
library(tidygeocoder)

# using the geo_osm() function to geocode locations
for(i in 1:nrow(data_df)){
  coordinates = geo_osm(data_df$location[i])
  data_df$long[i] = coordinates$long
  data_df$lat[i] = coordinates$lat
}
The data frame is now fully populated. It contains location names and their respective latitude and longitude coordinates.
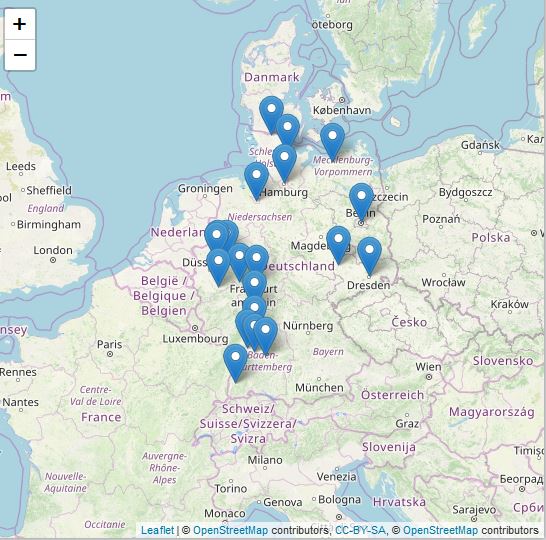
In a final step I use the Leaflet package in R for plotting the locations on a map using markers.
# importing leaflet, leaflet.extras and magrittr
library(leaflet)
library(leaflet.extras)
library(magrittr)

# creating a heat map for the burger search intensity according to Google trends
data_df %>%
  leaflet() %>%
  addTiles() %>%
  addProviderTiles(providers$OpenStreetMap.DE) %>%
  setView(mean(data_df$long),mean(data_df$lat),5) %>%
  addMarkers()

Data scientist focusing on simulation, optimization and modeling in R, SQL, VBA and Python


Leave a Reply