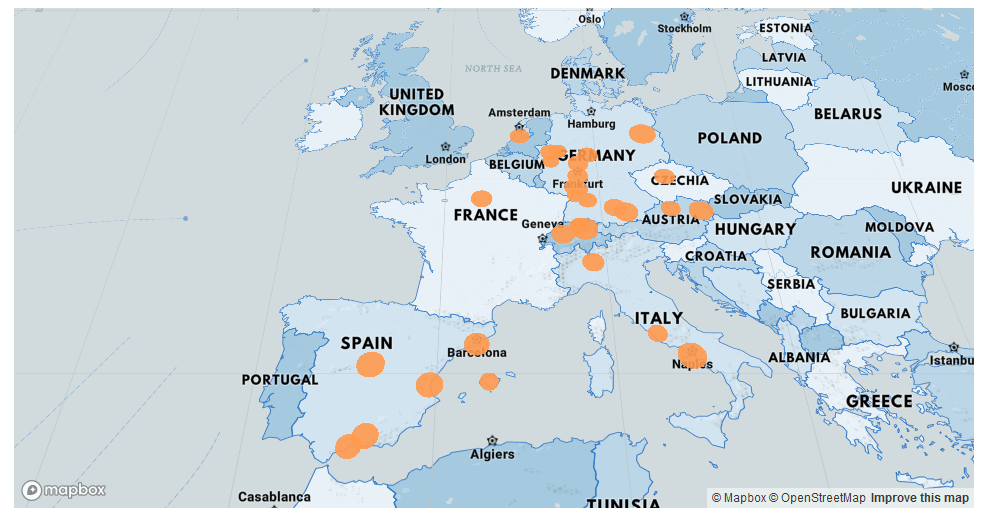
In this blogpost I provide a coding example in R for how to create a map-based scatterplot using the deckgl package. This can come in handy when visualising data with some spatial aspect. For example you might want to visualise the geo-spatial distribution of certain property clusters.
Before I can apply the deckgl package’s functionality I need a geocoded dataset, i.e. a dataset which contains information about longitude and latitude coordinates of the property of interest. For this I will use a geocoding function applying the Open Street Map API. I found the function on datascienceplus.com.
# osm geocoder
# source: https://datascienceplus.com/osm-nominatim-with-r-getting-locations-geo-coordinates-by-its-address/
osm_geocoder <- function(address = NULL)
{
  if(suppressWarnings(is.null(address)))
    return(data.frame())

  tryCatch(
    d <- jsonlite::fromJSON(
      gsub('\\@addr\\@', gsub('\\s+', '\\%20', address),
           'http://nominatim.openstreetmap.org/search/@addr@?format=json&addressdetails=0&limit=1')
    ), error = function(c) return(data.frame())
  )

  if(length(d) == 0)
    return(data.frame())

  return(data.frame(lon = as.numeric(d$lon), lat = as.numeric(d$lat)))
}
Next, I need to initialize the data I want to plot. I stored a list of cities in a separate csv-file. I thus read in this file and convert it into a dataframe. I then use the geocoding function to geocode all the cities in my data frame. In addition I add normally distributed values to the “entries” and “exits” column; required for determining e.g. circle design in the scatterplot.
# ensuring that required packages are loaded
library(deckgl)
## deckgl 0.1.8 wrapping deckgljs 6.2.4
## Documentation: https://crazycapivara.github.io/deckgl/
## Issues, notes and bleeding edge: https://github.com/crazycapivara/deckgllibrary(magrittr)
library(jsonlite)
library(dplyr)##
## Attaching package: 'dplyr'## The following objects are masked from 'package:stats':
##
## filter, lag## The following objects are masked from 'package:base':
##
## intersect, setdiff, setequal, union# setting up the data frames
scatter_data_df_1 <- data.frame(matrix(nrow=30,ncol=6))
column_names <- c("name","code","address","entries","exits","coordinates")
colnames(scatter_data_df_1) <- column_names
city_list_1_df <- read.csv("city list 1.csv",header = FALSE, stringsAsFactors = FALSE)
# geocode cities into longitude and latitude
for(i in 1:nrow(city_list_1_df)){
dum_coord <- osm_geocoder(toString(city_list_1_df$V1[i]))
scatter_data_df_1$name[i] <- paste0("city liste 1 : ",i)
scatter_data_df_1$code[i] <- c("CL1")
scatter_data_df_1$address[i] <- toString(city_list_1_df$V1[i])
scatter_data_df_1$entries[i] <- as.integer(rnorm(1,mean=3000,sd=1000))
scatter_data_df_1$exits[i] <- as.integer(rnorm(1,mean=3000,1000))
scatter_data_df_1$coordinates[i] <- list(c(as.numeric(dum_coord[1]),as.numeric(dum_coord[2])))
}
# print head of scatter_data_df_1
head(scatter_data_df_1)## name code address entries exits
## 1 city liste 1 : 1 CL1 Berlin Germany 5008 3112
## 2 city liste 1 : 2 CL1 Karlsruhe Germany 2002 2223
## 3 city liste 1 : 3 CL1 Stuttgart Germany 3453 3498
## 4 city liste 1 : 4 CL1 Mannheim Germany 2478 3041
## 5 city liste 1 : 5 CL1 Heidelberg Germany 3811 1003
## 6 city liste 1 : 6 CL1 Frankfurt Germany 1875 3135
## coordinates
## 1 13.38886, 52.51704
## 2 8.40342, 49.00687
## 3 9.180013, 48.778449
## 4 8.467236, 49.489591
## 5 8.694724, 49.409358
## 6 8.682092, 50.110644I can now create the scatterplot, using the deckgl function from the deckgl R-package.
# define properties of the plot
properties_1 <- list(
  getPosition = get_property("coordinates"),
  getRadius = JS("data => Math.sqrt(data.exits)"),
  radiusScale = 1000,
  getColor = c(255, 153, 77)
)

# plot scatterplot
deckgl(zoom = 10.5, pitch = 35, longitude = 8.40342, latitude = 40.00687) %>%
  add_scatterplot_layer(data = scatter_data_df_1, properties = properties_1) %>%
  add_mapbox_basemap(style = "mapbox://styles/linnartsf/cjq6p9q8f8zwf2rp74qf2o3d5")
We end up with the following scatterplot:

Please feel free to to check out my other posts on spatial data analysis and spatial data visualisation in R.

Data scientist focusing on simulation, optimization and modeling in R, SQL, VBA and Python


Leave a Reply