在之前的帖子中,我解释了基于 CAGR 的预测。基于 CAGR 的预测是一种非常简单的预测方法,通常应用于工业中,例如用于预测销售和产量。
简单的预测模型有好处。它们易于理解且易于实施。此外,它们包含的参数很少,因此其核心假设非常精确。这样可以说,简单的预测方法在许多情况下是最好的预测方法。换句话说:如果你试图预测未来,你不妨使用一个你完全理解并且可以随时向任何人解释的预测模型来做。
在这篇文章中,我想介绍基于简单移动平均计算的时间序列预测。移动平均线,也称为滚动平均值或滚动手段,用于分析和预处理历史时间序列数据。然而,它们可用于创建简单的预测算法。
我将简单移动平均线预测分为两类:
(a) 通过计算滚动平均值从历史数据进行预测
(b) 与 (a) 相同,但具有额外的内在增长参数
因此,类别 (b) 是基于 CAGR 的预测和滚动平均预测的组合。
与基于 CAGR 的预测一样,简单的滚动平均预测只能用于限制时间范围。
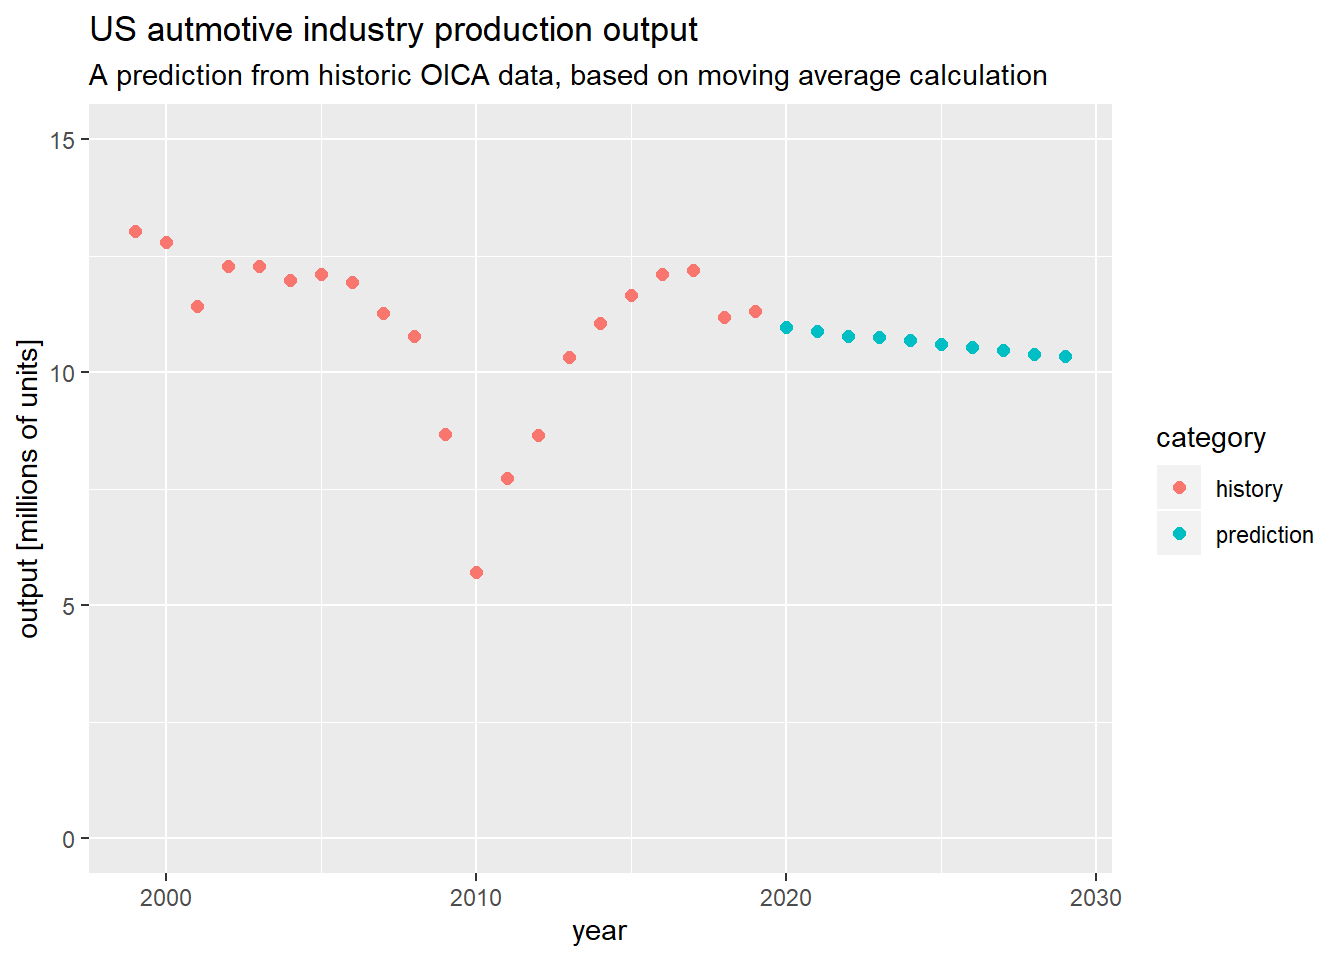
我在下面的编码示例中实现了这种预测方法,使用了一个计算定义长度的移动平均值的函数。我在 R 中实现了这个函数,并将其用于预测未来值。我将函数称为“sma_forecast”。它在下面的 R 代码中实现:
# a function for predicting future values of a time series, based on a simple moving average
# parameter "length" determines amount of time into the future predicted
# parameter "past" is a vector with all initial historic values; moving average will start as the mean over all of these values
sma_forecast = function(past,length){
  # create a empty vector of desired "length"
  future = rep(0,times = length)

  # connect past and future into one vector
  prediction = c(past,future)

  # iterate through prediction vector and populate the missing values
  for(i in (length(past)+1):length(prediction)){
    prediction[i] = mean(prediction[(i-length(past)):(i-1)])
  }

  # return the prediction as the final result
  return(prediction)
}
此工作流程的下一步是读入历史数据。在这种情况下,我读入了按国家/地区划分的汽车行业年产量数据,以特定国家/地区特定年份生产的单位数量来衡量。最后一步是使用 sma_forecast 计算预测。所有这些都是在下面的编码示例中使用 R 完成的:
# read in readxl
library(readxl)'
# read in data
data_df = as.data.frame(read_xls("oica.xls"))
# view header
head(data_df)
## year country total
## 1 2018 Argentina 466649
## 2 2018 Austria 164900
## 3 2018 Belgium 308493
## 4 2018 Brazil 2879809
## 5 2018 Canada 2020840
## 6 2018 China 27809196# view tail
tail(data_df)## year country total
## 835 1999 Turkey 297862
## 836 1999 Ukraine 1918
## 837 1999 UK 1973519
## 838 1999 USA 13024978
## 839 1999 Uzbekistan 44433
## 840 1999 Others 11965# filter out USA, using dplyr
library(dplyr)
data_df = filter(data_df,country=="USA")
# plot time series, using ggplot2 in R
library(ggplot2)
ggplot(data_df) +
geom_path(mapping = aes(x = year, y = total/1000000),
size = 2,
color = "red") +
labs(title = "US automotive industry production output",
subtitle = "historical OICA data, for 1999 - 2018") +
xlab("year") +
ylab("output [millions of units]") +
ylim(0,15)
# create new data frame with the historical data and the predictions; make it ggplot2 friendly
# -- re-arrange old data_df
library(dplyr)
data_df = data_df %>% arrange(desc(-year))
# -- use the sma_forecast function to calculate a forecast, based on simple moving average
predictionVals = sma_forecast(past=data_df$total,length = 10)
# -- create new empty dataframe
plot_df = as.data.frame(matrix(nrow=length(predictionVals),ncol= 4))
colnames(plot_df) = c("year","country","total","category")
plot_df$total = predictionVals
plot_df$category[1:nrow(data_df)] = "history"
plot_df$category[(nrow(data_df)+1):length(predictionVals)] = "prediction"
plot_df$year = data_df$year[1]:(data_df$year[1]+length(predictionVals)-1)
plot_df$country = data_df$country[1]
# -- plot the content of the dataframe, using gpgplot2
ggplot(plot_df) +
  geom_point(mapping = aes(x = year,
                          y = total/1000000,
                          color = category),
             size = 2) +
  labs(title = "US autmotive industry production output",
       subtitle = "A prediction from historic OICA data, based on moving average calculation") +
  xlab("year") +
  ylab("output [millions of units]") +
  ylim(0,15)
我的例子到此结束。
我可以添加的东西:
(a) 分割训练和测试集以评估方法
(b) 不同国家、时间间隔和预测长度的评估方法
(c) 对不同于生产输出数据的数据进行测试预测
(四)……
如果您觉得这篇文章有趣,您可以考虑查看我的其他文章,例如基于 CAGR 的预测、获取和分析 OICA 数据、时间序列分析、线性规划、汽车行业销售数据的公共资源等。

专业领域为优化和仿真的工业工程师(R,Python,SQL,VBA)


Leave a Reply